A staff member helps understand COVID-19 data through graphs
A university staff member has been studying numbers of COVID-19 cases in Louisiana since the pandemic first started.
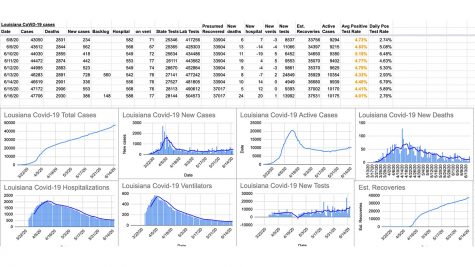
Ray DeJean, client connectivity leader for the Office of Technology, has collected data, studied the numbers and used spreadsheets to depict the numbers in graphs. His graphs show trends in new cases, deaths, hospitalizations, ventilators and tests.
DeJean started this endeavor back when Louisiana first showed signs of the coronavirus and the Louisiana Department of Health was providing case accounts every day, but according to DeJean, the LDH did not have a way to look at historical data.

“So, I started jotting down the numbers in the note app on my iPhone every day,” said DeJean. “That also let me start seeing trends of how fast the cases were growing.”
He began sharing screenshots of the notes on Facebook and adding his own interpretation of the data. Soon his Facebook friends and friends of theirs began liking and sharing the posts.
“I have friends that actually wait for me to message your chart to them daily,” said commenter, Jamie Lynn. “I send them a picture of it every day. It really helps put things into perspective. Thanks so much for doing this.”
DeJean stated that one of the most worrying trends he noticed were how politicized the entire pandemic has become.
“There are lots of conspiracy theorists out there advocating the public not to wear masks and not to get the vaccine when one is available since the vaccine is actually a computer chip developed by Bill Gates and Dr. Fauci who intend to take over the world,” stated DeJean. “I try to keep the politics out of my posts as I don’t believe the data nor the virus are political at all.”
According to DeJean, an important factor that has been overlooked during this situation is contact tracing because of privacy concerns.
“I’ve had many people tell me they can’t just look at the raw data from LDH since it is just numbers, and they don’t totally trust some of the news outlets since it is sensationalized too often,” said DeJean.
The data DeJean has found matches with the narrative from local officials and the media of Louisiana, and he believes we have done a great job in Louisiana when compared to other states.
“I know Governor Edwards also follows the data very closely and makes decisions based on the data without any political bias one way or the other,” stated DeJean. “I believe we’ve done a good job in Louisiana when you look at other states and governors who were just in denial for so long about what was actually happening.”
Your donation will support The Lion's Roar student journalists at Southeastern Louisiana University.
In addition, your contribution will allow us to cover our annual website hosting costs.
No gift is too small.

Austin Dewease is a communication major from Slidell. He has been a staff reporter with The Lion’s Roar since March 2020. Austin has a passion for filmmaking,...


Ann Burch • Aug 18, 2020 at 11:55 am
In many circles, the Lion is Jesus Christ and the Lionsroar is his voice. My prayers for you is that you will someday run into the lion face to face and will understand his roar.
One day you will need a scientific answer to something really important and you will find the answer only in the Bible. One day you will know that the Bible has more to do with science than you know. Always praying for you. You are so very dear to me. I love you.